In this article, we are going to talk about some important representative values and one of the main representative methods called Stem and Leaf Plot.
Mode
Let’s take the idea about the mode by using an example.
Example:
Marks obtained by 10 students for a mathematics test is given below.
78 93 45 67 82 54 82 76 80 97
The number of data in this collection is 10.
Let’s arrange the above marks in ascending order.
45, 54, 67, 76, 78, 80, 82, 82, 93, 97
The marks that have been obtained by the most is 82.
In a collection of data, some of the values could be identical.
The value which occurs most of 10 is called the Mode of that collection of data.
It is not necessary to write the data in ascending order to find the mode.
The collection of data may have two modes. Such a distribution of data area called Bi-Modal distribution.
Example : 4, 3, 5, 2, 3, 8, 4
Modes are 3 and 4.
In this case, we have to mention both modes as the answer.
There are distributions also with three modes. Those areas called Trimodal Distribution.
Example: 23, 65, 46, 32, 65, 84, 23, 16, 56, 32
Modes are 23, 65 and 32
If a collection have more than 1 mode, those distributions are called Multi-modal distribution.
Median
Median has to be discussed under two categories.
01. Collection of data with an odd number of values.
Example:
8, 7, 3, 9, 4, 5, 2
Arrange the data in ascending order.
2, 3, 4, 5, 7, 8, 9
There are 7 data. The 4th datum is in the center.
Its value is 5.
So the Median is 5.
So the number of values in a collection of data is an odd number. The median is the value in the center when the values are arranged in ascending order.
How to find the place of the median in a collection of odd number of data easily?
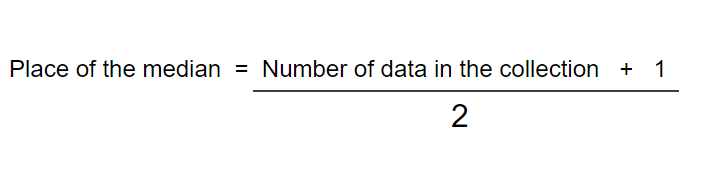
According to the above example,
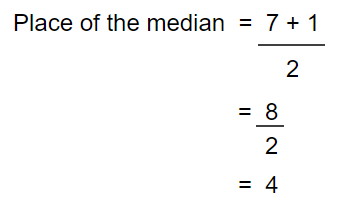
So, the place of the median should be 4th place.
Exercise:
Find the median of the collection of data.
47, 23, 85, 72, 64, 53, 31, 94, 66
02. Collection of data with an even number of values.
Example:
8, 6, 8, 2, 4, 7, 3, 9
Arrange the data in ascending order.
2, 3, 4, 6, 7, 8, 8, 9
There are 8 values in this collection of data.
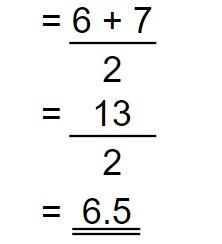
The two data in the center are 4th and 5th data. Those values are 6 and 7 respectively.
If there is an even number of in the collection of data, the median is half the sum of the values the two data in the center.
Its a must to arrange data in ascending order.
In the above example, the median is,
Mean
Mean is also called as the average value in daily life.
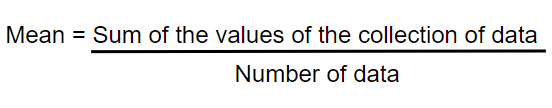
Mean is obtained when,
The sum of all the values of the collection of data is divided by the number of values.
Let’s make it clear through an example.
Example:
Marks obtained by Kevin for his mid-term test for 10 different subjects are as follows.
75, 82, 54, 98, 81, 69, 96, 74, 66, 98
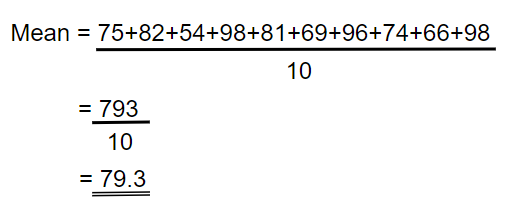
His average mark or the mean value is 79.3
It is not necessary to arrange data in ascending order to find mean.
Except for these three representative values mode, median and mean, there are another things which will help you on the way in statistics.
It is Range.
What is Range?
Range is the difference between the greatest value and the least value of a collection of data.
Example:
Let’s take the previous example which we have taken to discuss about mean, about Kevin’s marks.
To find the range, you have to arrange data in ascending order.
54, 66, 69, 74, 75, 81, 82, 96, 98, 98
54 – Least value
98 – Greatest value
Range = Greatest value – Least value
= 98 – 54
= 44
Stem and Leaf Plot
Stem and Leaf plots are one of the main data representation methods.
There are few rules that you have to follow when you are entering data to a stem and leaf plot.
- Only the digit in the unit place is indicated as the leaf.
- We don’t use commas to separate leaf values. We just leave a gap.
- It is easier to make a stem and leaf plot if we arrange our data in ascending order before we enter our data. Otherwise, you can just enter your data to the given order and arrange the data in ascending order in another stem and leaf plot.
Let’s discuss an example.
The marks obtained by 20 students for a mathematics test is given below.
| 17 | 20 | 15 | 10 | 23 |
| 13 | 19 | 25 | 9 | 11 |
| 24 | 23 | 15 | 18 | 17 |
| 8 | 19 | 25 | 20 | 14 |
You can arrange your data in ascending order and then enter.
| 8 | 9 | 10 | 11 | 13 |
| 14 | 15 | 15 | 17 | 17 |
| 18 | 19 | 19 | 20 | 20 |
| 23 | 23 | 24 | 25 | 25 |
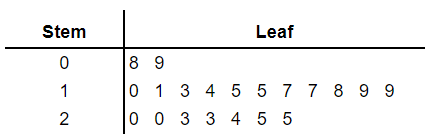
Key 2 | 3 means 23
The above method is easier when you have small number of data.
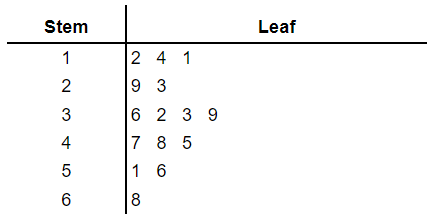
Usually, when we are entering data to stem and leaf diagram, we don’t arrange the data in ascending order instead of that we just enter the value according to the given order in a separate stem and leaf diagram and then in another diagram you have to rearrange the data in ascending order.
| 17 | 20 | 15 | 10 | 23 |
| 13 | 19 | 25 | 9 | 11 |
| 24 | 23 | 15 | 18 | 17 |
| 8 | 19 | 25 | 20 | 14 |
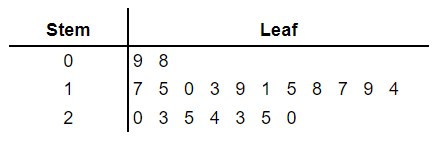
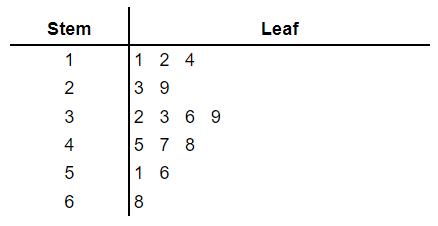
Now draw another stem and leaf diagram and enter the values belongs to each stem in ascending order.
Key 1 | 5 means 15
Now let’s move on to another example with decimal values as data.
The height of 15 different trees in meters given below.

| 4.7 | 3.6 | 1.2 | 2.9 | 6.8 |
| 3.2 | 5.1 | 2.3 | 1.4 | 3.3 |
| 5.6 | 1.1 | 4.8 | 3.9 | 4.5 |
Key 4 | 5 means 4.5
Exercise
01. Find the mode, the median, the mean and the range of each collection of data.
- 9, 10, 13, 11, 13, 8, 9, 7, 11, 6, 9
- 34, 33, 19, 34, 46, 24, 54, 33, 34
- 79, 79, 81, 71, 79, 66, 70, 71
- 4.5, 3.5, 5.8, 2.3, 4.9
- 13.5, 33.4, 23.6, 9.3
02. The number of candies in 10 jars is given below.
50, 51, 49, 48, 50, 51, 50, 51, 48, 52
For these jars
- Find the mode
- Find the median
- The mean number of candies in a jar.
03. The lengths of the calls received on a certain day by a person who uses a mobile phone are given below to the nearest minute.
4, 3, 6, 11, 2, 4, 8, 4, 5, 7, 3, 5, 4, 9, 12, 5, 4, 3
- Write the range of the given set of data.
- What is the mode?
- Write the median.
- Using the mean, estimate the time in hours and minutes that could be expected to be spent on 100 calls that are received by this person.
04. The height of 30 students in a certain class is given in centimeters.
| 116 | 124 | 112 | 115 | 110 | 123 |
| 123 | 115 | 113 | 119 | 114 | 125 |
| 126 | 121 | 131 | 125 | 117 | 121 |
| 135 | 112 | 127 | 128 | 129 | 128 |
| 132 | 115 | 110 | 132 | 121 | 131 |
- Represent the above data in a stem and leaf plot.
- What is the height of the shortest student?
- What is the height of the tallest student?
- Find the range of their heights.
- Find the mode.
Download the Exercises PDF
Download the exercise for stem and leaf plot, Mode, Median, Mean.
FAQ
What is mode in math?
The value which occurs most in a collection of data called the Mode.
What is median in math?
The middle of the sorted collection of numbers.
How to find median of collection of data with an odd number of values?
How to find median of collection of data with an even number of values?
If there is an even number of in the collection of data, the median is half the sum of the values the two data in the center.
What is the mean in math?
Mean is the average number in a collection of numbers.
How to find mean in math?
What is Range?
Range is the difference between the greatest value and the least value of a collection of data.
What is stem and leaf plot?
Stem and Leaf plot is a data representation method.
I enjoy, lead to I found exactly what I was taking a look for.
You have ended my 4 day long hunt! God Bless you. Have a great day.
Bye
Very easy to learn. Thank you.
This is what I’m searching for. good content.
A very good lesson. Well explained.
Amazing lesson. Thanks.
nicely explained.
great way to learn stem and leaf plot